

MD&A · 2025
In this section4 topics
Overview of Operations
Overview of Operations
FY25 EXECUTIVE SUMMARY
FY2025 demonstrated the Company’s resilience against the backdrop of a dynamic operating environment. Strong USD revenue growth and continued volume expansion reflected robust demand strength across key markets, despite foreign exchange headwinds and temporary operational disruptions.
Sales in FY25 delivered solid revenue growth (in USD terms) despite foreign exchange headwinds. USD sales reached USD 554mn, increasing 9.2% YoY, reflecting continued demand from key customers. However, the appreciation of the Thai Baht was moderated with a reported THB sales growth of 2.8% YoY, totaling THB 18,223mn. Whereas, the net weight tons (NWT) increased by 8.8% YoY, demonstrating healthy volume expansion.
Gross Profit Margin (GPM) was 25.1% slightly declined by 2.6%-point YoY, primarily attributable to a lower proportion of premium mix in 1H25 and U.S. tariff-related sales support.
Operating profit was THB 2,667mn, declined by 18.2% YoY, due to higher selling expenses primarily due to consulting fees, higher personnel expenses and freight-related expenses.
Adjusted net profit (excluding Transformation costs) was THB 3,432mn, decreasing 12.3% YoY with an adjusted net margin of 18.8%, compared to 22.1% in FY24.
Reported net profit was THB 2,978mn, down 17.2% YoY, reflecting margin pressure from elevated expenses, tariff support measures, and FX losses. Despite, margin pressure, the Company maintained resilient profitability and volume growth, positioning the business for continued premium-mix recovery and operational efficiency improvements going forward.
Operating Results & Financial Condition
Operating Results & Profitability
P&L ANALYSIS:
FINANCIAL PERFORMANCE
(Units: THB mn) | 2024 | 2025 | %YoY |
Sales and service | 17,729 | 18,223 | 2.8% |
Cost of sales and service | (12,810) | (13,647) | 6.5% |
Gross profit | 4,919 | 4,577 | - 7.0% |
SG&A | (1,656) | (1,909) | 15.3% |
Operating profit | 3,263 | 2,667 | - 18.2% |
Other gain (loss) | (214) | (44) | 79.6% |
Other income | 696 | 513 | - 26.2% |
EBIT | 3,744 | 3,137 | - 16.2% |
Finance costs | (6) | (10) | 72.4% |
Income tax expense | (141) | (149) | 5.7% |
Reported net profit | 3,597 | 2,978 | - 17.2% |
Adjusted net profit1 | 3,911 | 3,432 | - 12.3% |
EBITDA | 4,312 | 3,744 | - 13.2% |
EPS (THB/share) | 1.20 | 1.0 | - 17.2% |
Gross profit margin | 27.7% | 25.1% | - 2.6% |
Operating profit margin | 18.4% | 14.6% | - 3.8% |
EBITDA margin | 24.3% | 20.5% | - 3.7% |
Reported net profit margin | 20.3% | 16.3% | - 4.0% |
Adjusted net profit margin1 | 22.1% | 18.8% | - 3.3% |
Remarks: due to rounding, some figures presented may not reflect the exact actual values; 1: adjusted net profit/adjusted net profit margin (NPM) excludes transformation project cost
PERFORMANCE ANALYSIS
ANNUAL PERFORMANCE
In the year of 2025, ITC reported strong sales growth in USD, increasing by 9.2% YoY, driven by robust demand from key customers and world pet food companies in the U.S. market, despite tariff sales support to U.S. clients, while EU markets still remains strong as planned. However, the appreciation of the Thai Baht limited revenue growth in local currency, with sales in THB rising by only 2.8% YoY to THB 18,223mn, despite an 8.8% YoY increase in NWT sales volume.
2025 Gross profit - GPM declined to 25.1%, down 2.6%-point YoY, due to average lower proportion of premium products in 1H25 compared to last year and tariff sales support. Meanwhile, SG&A expenses surged by 15.3% YoY, primarily due to consulting fees, higher personnel expenses, and selling expenses (freight cost) in 4Q25.
The negative impact from foreign exchange* dropped significantly by 79.6% YoY. However, other incomes declined by 26.2% YoY, primarily due to lower interest income. Additionally, income tax expenses rose by 5.7% YoY, mainly driven by the recognition of the global minimum top-up tax.
*net off gain/loss on exchange rate against the gain/loss on financial instruments; forward contracts
As a result, 2025 Adjusted net profit fell by 12.3% to THB 3,432mn from THB 3,911mn, and reported net profit fell by 17.2% YoY to THB 2,978mn, down from THB 3,597mn in the same period last year. While adjusted net profit margin fell 3.3% point to 18.8% and net profit margin down 4.0% point to 16.3% from the previous year.
BUSINESS PERFORMANCE ANALYSIS
Performance breakdown | 2024 | 2025 | %YoY |
Sales (THB mn) | 17,729 | 18,223 | 2.8% |
Americas | 8,937 | 10,529 | 17.8% |
Europe | 2,749 | 2,657 | - 3.3% |
Asia & Oceania (AOA) | 6,044 | 5,037 | - 16.7% |
Remarks: due to rounding, some figures presented may not reflect the exact actual values
For FY25, Americas sales increased by 17.8% YoY, supported by stronger momentum driven by private label expansion and new product launches. In addition, Europe slightly decline by 3.3% YoY, due to softer performances in 1H25, however performances improved in 2H25 supported by targeted commercial initiatives. In contrast, Asia & Oceania declined 16.7% YoY, from one of the world petfood company client demands dropped throughout the year, despite relatively stable performances across other Asia regional accounts. The FY25, sales portion of Americas was 57.8%, Asia & Oceania 27.6% and Europe 14.6% respectively.
Performance breakdown | 2024 | 2025 | %YoY |
Cat food | 12,286 | 11,784 | - 4.1% |
Dog food | 3,051 | 3,291 | 7.9% |
Pet treats | 2,052 | 2,801 | 36.5% |
Total pet food | 17,389 | 17,876 | 2.8% |
Other segments | 340 | 348 | 2.2% |
Total sales (include others) | 17,729 | 18,223 | 2.8% |
Sales volume (Tons)* | 103,318 | 112,381 | 8.8% |
Remarks: due to rounding, some figures presented may not reflect the exact actual values; *sales volume (tons) include pet food only
For FY25, cat food remained the largest revenue contributor at THB 11,784mn, which declined slightly by 4.1% YoY. However, strong demand for pet treats (+36.5% YoY) and dog food (+7.9% YoY) supported the overall pet food sales growth of 2.8% YoY to THB 17,876mn.
Pet food sales proportion by channel | 2024 | 2025 | %YoY |
World pet food companies | 48.2% | 49.6% | 1.3% |
Brand owners/importers | 34.5% | 33.2% | - 1.3% |
Private label | 15.9% | 16.0% | 0.1% |
Own label | 1.4% | 1.2% | - 0.1% |
For FY25, the sales mix of world pet food companies increased by 1.3% points YoY, while private labels increased slightly by 0.1% points YoY, reflecting a broader, full-year shift toward established global brands amid evolving consumer preferences in the pet food market. In addition, the contribution from importer brands and own labels declined by 1.3% points and 0.1% points YoY, respectively.
Liquidity & Capital Adequacy
LIQUIDITY AND CAPITAL ADEQUACY (CASHFLOW)
STATEMENT OF CASH FLOWS
(Unit: THB mn) | 31-Dec-25 |
Beginning cash and cash equivalents | 5,408 |
Net cash from operating activities | 3,074 |
Net cash from investing activities | 1,582 |
Net cash used in financing activities | (3,483) |
Others* | (93) |
Ending Cash and cash equivalents | 6,489 |
remark: *others refer to exchange gains on cash and cash equivalents
Cash and cash equivalents as of December 31, 2025, were THB 6,489mn, an increase of 20.0% YoY, from net cash from operating and investing activities. Net cash receipt from investing activities was THB 1,582mn, consisting primarily of THB 2,367mn in net cash received from short-term investments and THB 1,123mn cash used for purchasing property, plant, and equipment. In addition, net cash payments used in financing activities were THB 3,483mn, consisting mainly of net cash paid for dividend payment of THB 3,450mn and other finance costs paid.
Asset Management Capability
ASSET MANAGEMENT CAPABILITY (BALANCE SHEET)
STATEMENT OF FINANCIAL POSITION
(Unit: THB mn) | 31-Dec-24 | 31-Dec-25 | %Inc (Dec) |
Cash and cash equivalents | 5,408 | 6,489 | 20.0% |
Short-term investments | 6,281 | 4,000 | - 36.3% |
Trade and other receivables, net | 3,951 | 3,766 | - 4.7% |
Inventories, net | 3,535 | 4,338 | 22.7% |
Investment in debt instruments measured at amortized cost | 873 | 849 | - 2.7% |
Other current assets | 502 | 686 | 36.6% |
Total current assets | 20,550 | 20,127 | - 2.1% |
Property, plant and equipment, net | 6,009 | 6,484 | 7.9% |
Other non-current assets | 369 | 362 | - 1.9% |
Total non-current assets | 6,378 | 6,846 | 7.3% |
Total assets | 26,928 | 26,973 | 0.2% |
Trade and other payables | 1,815 | 2,235 | 23.2% |
Other current liabilities | 281 | 75 | - 73.5% |
Total current liabilities | 2,096 | 2,310 | 10.2% |
Employee benefit obligations | 595 | 680 | 14.3% |
Other non-current liabilities | 98 | 157 | 59.4% |
Total non-current liabilities | 693 | 837 | 20.7% |
Total liabilities | 2,789 | 3,147 | 12.8% |
Total equity | 24,139 | 23,826 | - 1.3% |
Total liabilities and shareholders' equity | 26,928 | 26,973 | 0.2% |
*due to rounding, some figures presented may not reflect the exact actual values
As of December 31, 2025, total assets were THB 26,973mn, an increase of 0.2% from December 31, 2024, mainly from higher cash and cash equivalents, partially offset by the lower short-term investments. Property, plant and equipment slightly increased primarily due to the construction of a new automatic warehouse (ASRS) and the purchase of new machinery.
As of December 31, 2025, total liabilities were THB 3,147mn an increase of 12.8% from December 31, 2024, mainly due to higher trade and other payables, employee benefit obligations, and the accrual for global minimum tax under other non-current liabilities.
As of December 31, 2025, total equity was THB 23,826mn, a decrease of 1.3% from December 31, 2024, primarily due to the dividend payment made in April and August 2025.
Debt Securities with Financial Ratio Requirements
Debt Securities with Financial Ratio Requirements Issued?
No
Factors That May Affect Financial Condition
Factors or Incidents That May Materially Affect Financial Condition
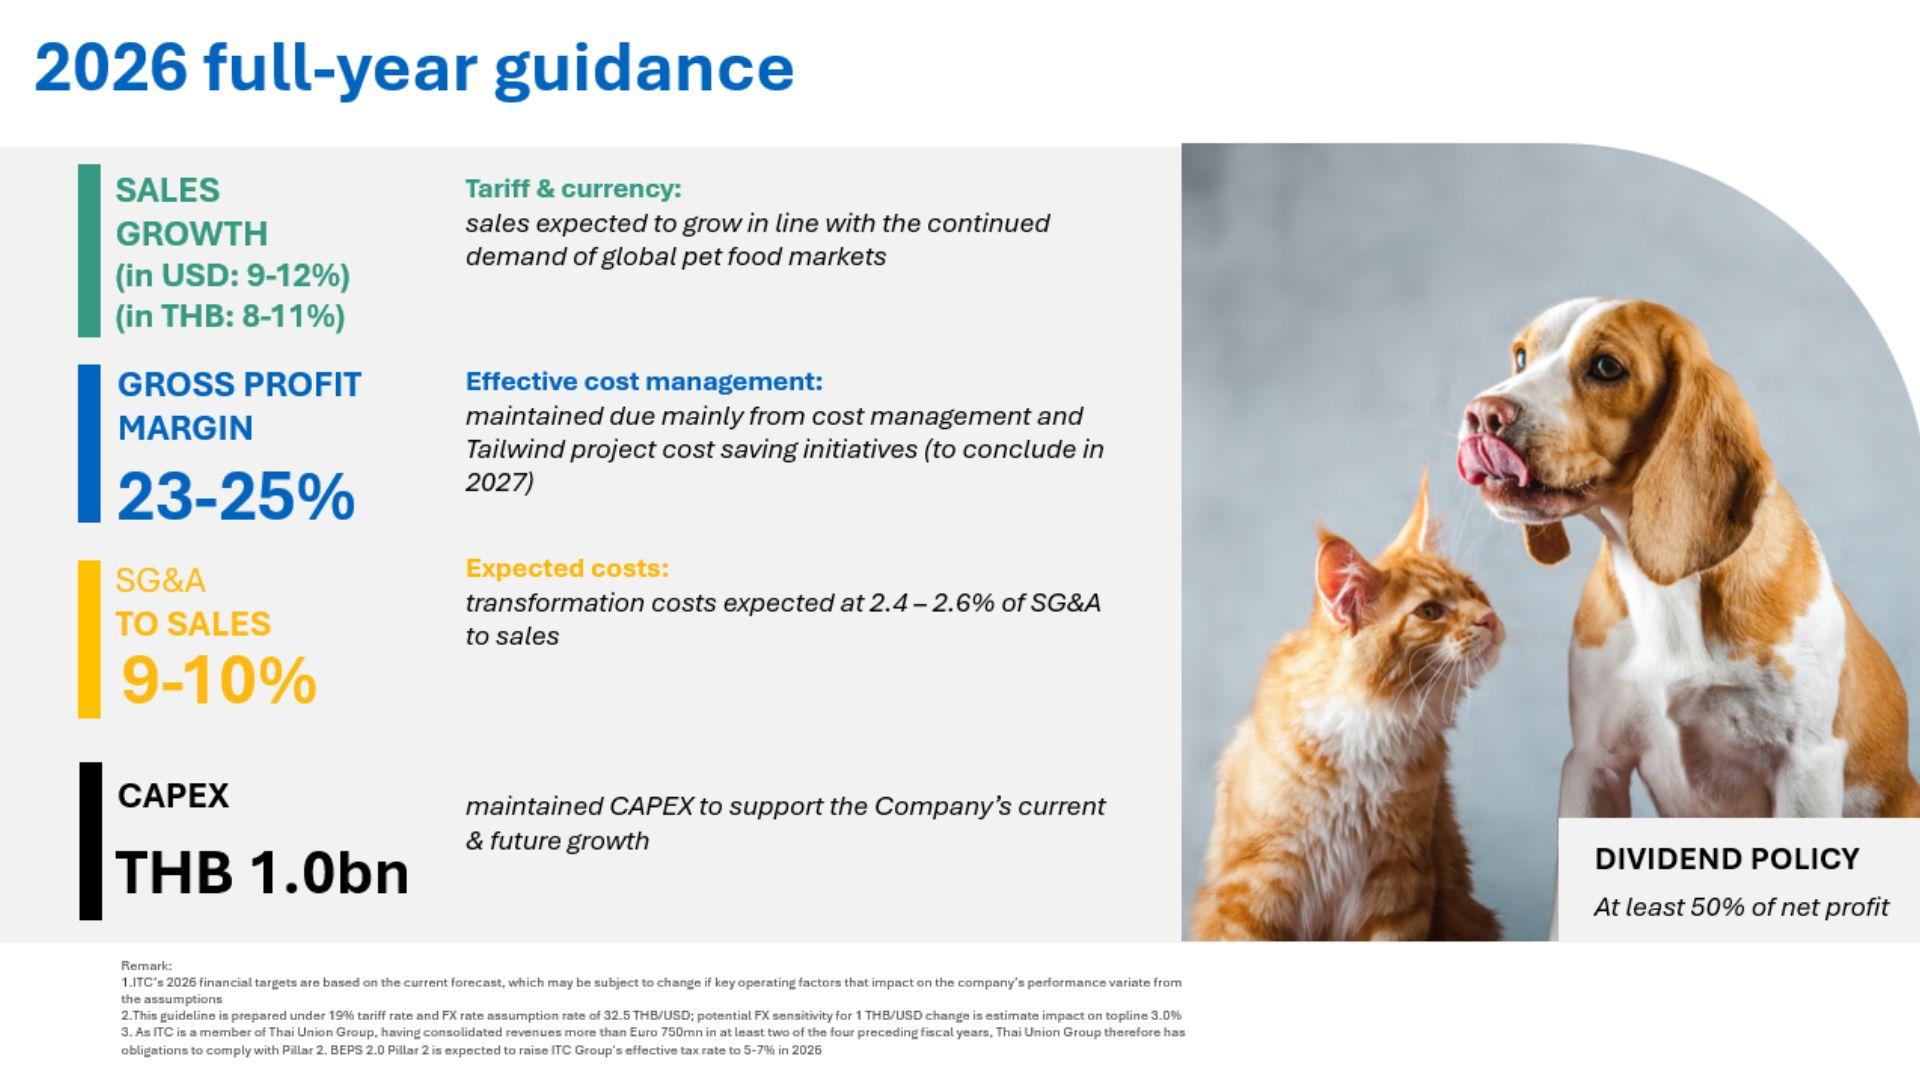
Looking ahead to 2026, ITC expects to sustain strong business momentum, targeting 9-12% growth in USD sales, driven by core customer partnerships and expansion into higher-value segments. In addition, the Company aims to target 15% of total revenue for 2026 from its new product development segment (NPDs), and innovation reflective of the global shift towards pet wellness across 3 innovation strategy pillars: (1) innovation through open collaboration, (2) pet journey toward longevity and (3) science-backed innovation with proven palatability.
Growth will continue to be led by the U.S., alongside further expansion into the Chunk & Pate segment, which the Company has newly secured with a leading private label player in the U.S., through an initial purchase order received in December 2025. This development will broaden ITC’s product portfolio and strengthen its presence within the U.S. pet food market. ITC also aims to increase revenue from the development of new NPDs and pet treats to meet the growing and evolving demand of pet owners.
In Europe, the Company will focus on new customer acquisition in a highly competitive and promotional environment, supported by continued cost-efficiency initiatives and operational excellence, while in Asia, growth will be driven by innovation-led, health-focused products tailored to aging pet populations.
Projects or R&D Affecting Future Results
KEY BUSINESS DEVELOPMENTS in Y25
2025 was a year marked by both achievements and challenges, during which the Company demonstrated resilience, adaptability, and a continued commitment to innovation. Growth during the year was supported by new commercial successes across key markets, including expansion in the U.S., Europe, and Asia totaling 42 new customers. The Company’s new product developments (NPDs) remained a core driver of progress, through close R&D collaboration with strategic partners, with collaborations already materialized and has begun to deliver breakthrough concepts designed to enhance pet health and wellbeing (through strengthening bonds between pets and owners), with several projects progressing toward commercialization.
MOU signing with Chiang Mai University, Kasetsart University & Prince of Songkla University to advance research in pet food nutrition
ITC had signed a Memorandum of Understanding (MoU) in 2025, with two leading academic institutions: the Faculty of Veterinary Medicine, Chiang Mai University and the Faculty of Veterinary Medicine at Kasetsart University. In addition, in January 2026, the Company expanded its academic collaboration with another signing of an MoU with the Faculty of Veterinary Science at Prince of Songkla University. These partnerships aim to enhance collaboration in pet food nutrition, jointly support research projects, foster academic activities to advance industry knowledge, enhance innovation, and promote long-term pet health. The initiative is poised to elevate industry standards and improve pet nutrition outcomes in Thailand.
Progress from the transformation project
ITC Continued to advance key initiatives under the Tailwind Program, which focuses on 3 pillars: commercial, manufacturing, procurement; aimed at unlocking new opportunities and improving efficiency. In FY25, the Company had realized cumulative operating profit uplift of USD 22mn out of its USD 50mn target by FY2027 (annualized operating profit uplift) The OP uplift is calculated based on 2023, when the program started. Commercial initiatives focused on consumer insights and portfolio expansion, while manufacturing efforts centered on cost reduction and automation. Procurement initiatives focuses on improving purchasing efficiency to enhance value and reduce cost.